Jump to:
Purpose
ECG:
To provide a high throughput method to obtain Electrocardiograms in a conscious mouse.
Echo:
To assess the functionality of the heart in order to determine the presence of a mutant phenotype.
Experimental Design
- Minimum number of animals : 5-7M + 5-7F
- Age at test: Ideal age = 12 weeks ±3 days.
- Sex: We would expect the results of this test to show sexual dimorphism
Procedure
ECG:
1. The lead plates are to be snapped into place onto the top of the pre-amplifier tower. The covering is removed to reveal three gel coated pads surrounded by a sticking plate. The plate will need to be covered with the extra cover in the package.
2. Turn on the combined amplifier and the pre-amplifier tower.
3. Double click the icon ECG acquisition on the acquisition computer.
4. Open the ECG set up file (for default settings).
6. Place mouse on pad, lowering the Red Acrylic Cubby to surround the mouse on 3 sides discouraging escape.
7. Press Start.
8. After the desired acquisition time, (5-10 minutes) stop the reading. There will be one long reading.
9. Save the data.
10. For additional readings create a new session using the same settings as before.
11. When saving sections with good readings, highlight the selected area and then save.
Echo:
1. Place animal in induction chamber and anesthetize the mouse and ensure sedation.
2. Once the animal is sedated, move it to a nose cone for hair removal using cream. Only apply cream to the area of the chest that will be utilized for imaging. Once the hair is removed, wipe area with wet gauze to ensure all hair is removed.
3. Move the animal to the imaging platform and tape its paws to the ECG lead plates and insert rectal probe. Body temperature should be maintained at 36-37°C. During imaging, reduce anesthesia to maintain proper heart rate. If the animal shows signs of being awake, use a higher concentration of anesthetic.
* Before imaging, decrease the Sector X so that the frame rate increases to 110 and change the orientation of the heart by clicking the dot as shown in Fig. 1.
4. Apply gel on to the area to be imaged.
5. Lower the probe to the gel until it makes contact, making sure that all areas of the probe are covered with gel.
6. The image of the heart should be taken in the short-axis mode with papillary muscles being the point of reference. The papillary muscles should be parallel to the screen as shown on Fig. 2. Some manipulation of the platform may be necessary in order to get a clear image.
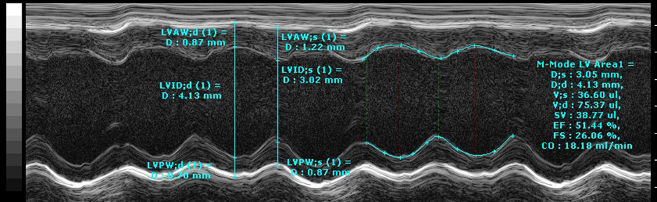
7. Once the papillary muscles are parallel in B-Mode, press the M-mode button and place the yellow line in the middle of the LV. Change the Display window to 1000ms. If image is not clear as in Fig. 3, move the yellow line to the left or right. Another option is to leave the line in the center of the LV and move the platform left or right, forward or backwards.
8. When a good clear image is obtained press the Cine store button to save the M-mode data. Save at least 4 short loops of data.
9. Once imaging is complete, remove animal from the platform and allow to recover atop a heating pad.
Figure 1.
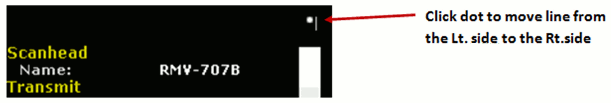
Figure 2.
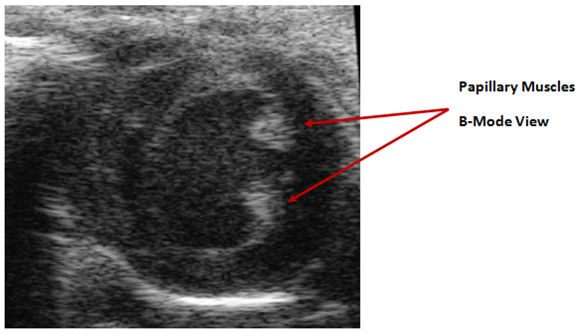
Figure 3.
Notes
ECG:
Data Analysis
- Open Emouse Analyses icon
- Select ECG signals
- Choose folder (all readings in folder will show)
- Click PNN X (for mice: N-N> than 6 ms)
- Choose file(s) by highlighting
- Go
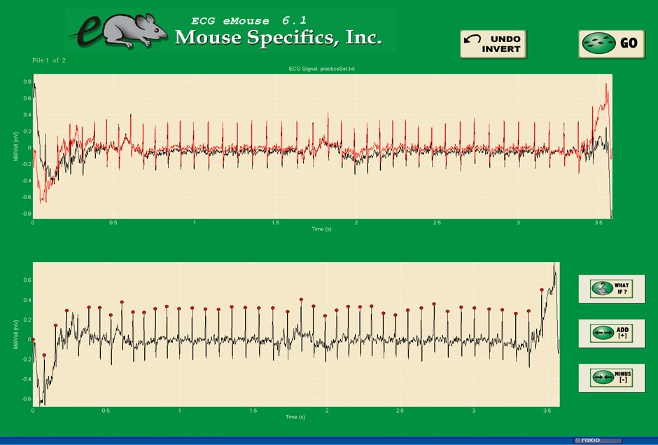
- Bottom file is the corrected file
- Red dots should be on peak of R waves, if image appears inverted click invert
- Click Add, or minus if R waves are not marked with red dots or if too many are marked
- L click to zoom in
- R click to zoom out
- ‘What if?’ button to remove unwanted sections
- L click image (zooms in)
- L click left boundary
- L click right boundary
- Options- click more if want to exclude more sections
- Undo available
- Go
- Here can input animal data if desired
- Save- For the first mouse in in group, hit save, a new results folder will be created within the folder with the mouse data. Then can click quick save or next.
- For the rest of the mice in the series, can hit quick save at this point- saves in last selected file – will group all files together in same excel sheet.
- Open Emouse Analyses icon
- Select ECG signals
- Choose folder (all readings in folder will show)
- Click PNN X (for mice: N-N> than 6 ms)
- Choose file(s) by highlighting
- Go
- Bottom file is the corrected file
- Red dots should be on peak of R waves, if image appears inverted click invert
- Click Add, or minus if R waves are not marked with red dots or if too many are marked
- L click to zoom in
- R click to zoom out
- ‘What if?’ button to remove unwanted sections
- L click image (zooms in)
- L click left boundary
- L click right boundary
- Options- click more if want to exclude more sections
- Undo available
- Go
- Here can input animal data if desired
- Save- For the first mouse in in group, hit save, a new results folder will be created within the folder with the mouse data. Then can click quick save or next
- For the rest of the mice in the series, can hit quick save at this point- saves in last selected file - will group all files together in same excel sheet
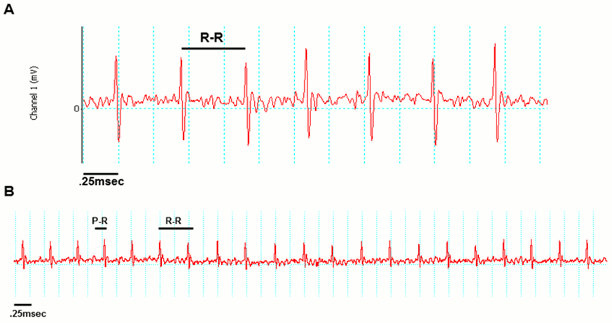
Examples of good readings
Data QC
Analysis room should be dim and quiet. Keep the door closed preferably while analysis is taking place.
Figure A. Taking a reading
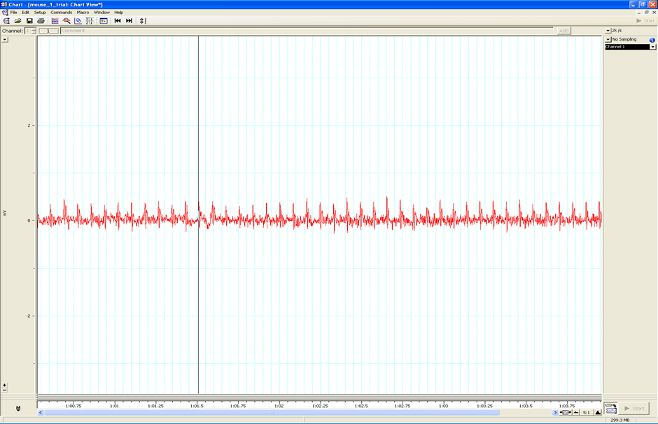
Figure B. Saving a section of the reading
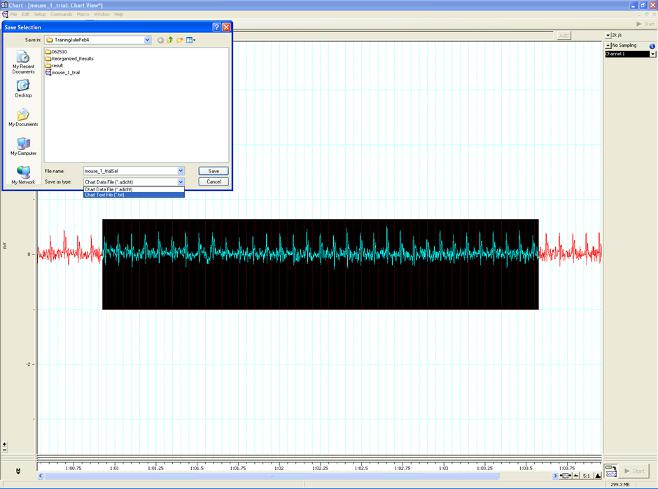
Figure C. Analysis phase, with the options to remove sections on the ‘What if?’ button below.
Echo:
Each animal should have at least four short M-Modes for data analysis.
In order to analyze these data files, you must use the software package provided by Visualsonics. The analysis for these files will involve performing a trace of two cardiac cycles per image as well as analyzing the wall measurements for diastole and systole as seen in Fig. 3. The parameters derived from the trace are End systolic/diastolic diameter (d;s/d;d), systolic/diastolic volume (V;s/V;d),stroke volume (SV), ejection fraction (EF), fractional shortening (FS), heart rate (HR) and body temp (temp).
These data points can be displayed in a bar graph or a line graph.